Streamline your business with custom dashboards and automation
We build internal tools that replace your messy spreadsheets, automate your reporting, and give your team real-time visibility into what matters.
How It Works
From first call to live dashboard — a clear, low-overhead process built around your schedule.
We start with a quick discovery call to understand your business, workflows, and biggest pain points — so we know exactly where to focus.
We audit your existing spreadsheets, tools, and data sources to identify inefficiencies and define the KPIs and requirements that matter most.
We design and develop a custom dashboard tailored to your team — integrating your data sources, automating key processes, and keeping things intuitive.
We demo your dashboard, incorporate feedback, walk your team through it, and ship it live. You leave with a tool your team will actually use.
See What We Build
An example marketing agency scenario — see a demo dashboard that shows how we simplify your operations.
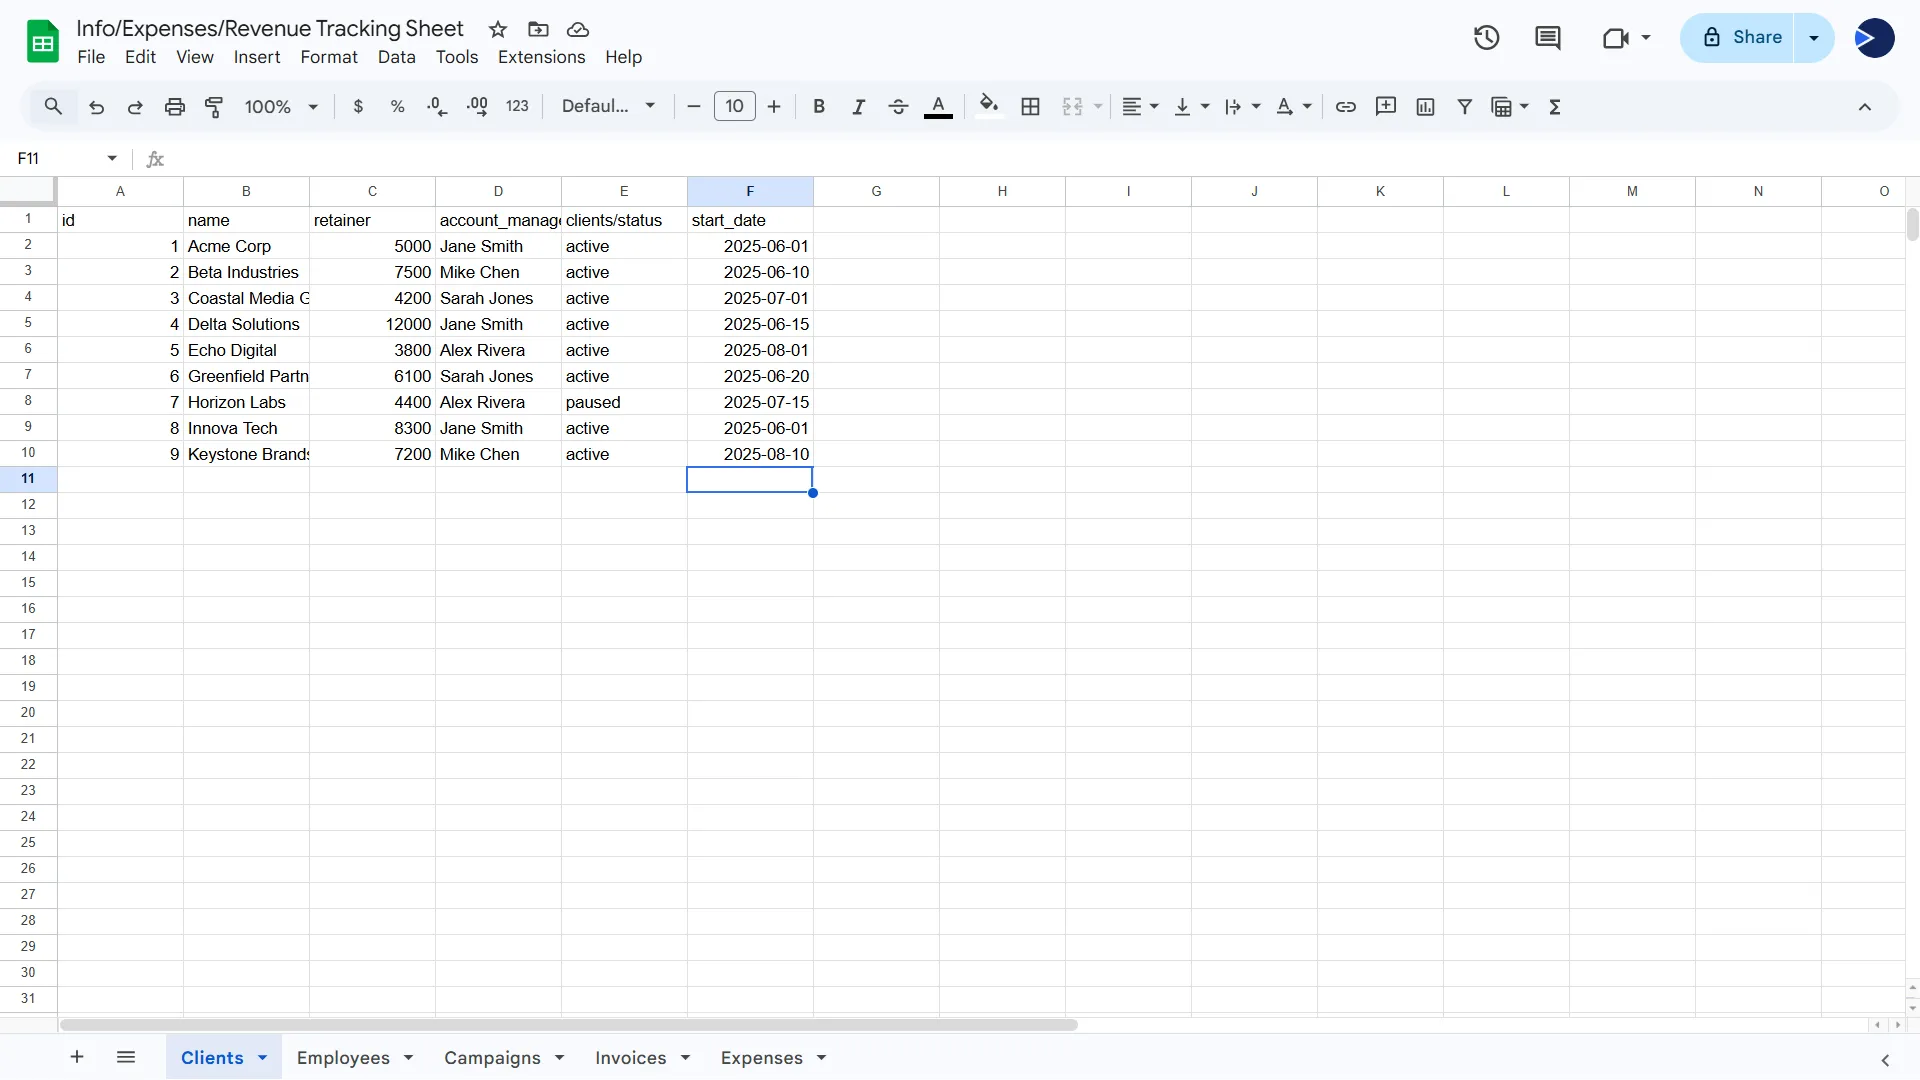
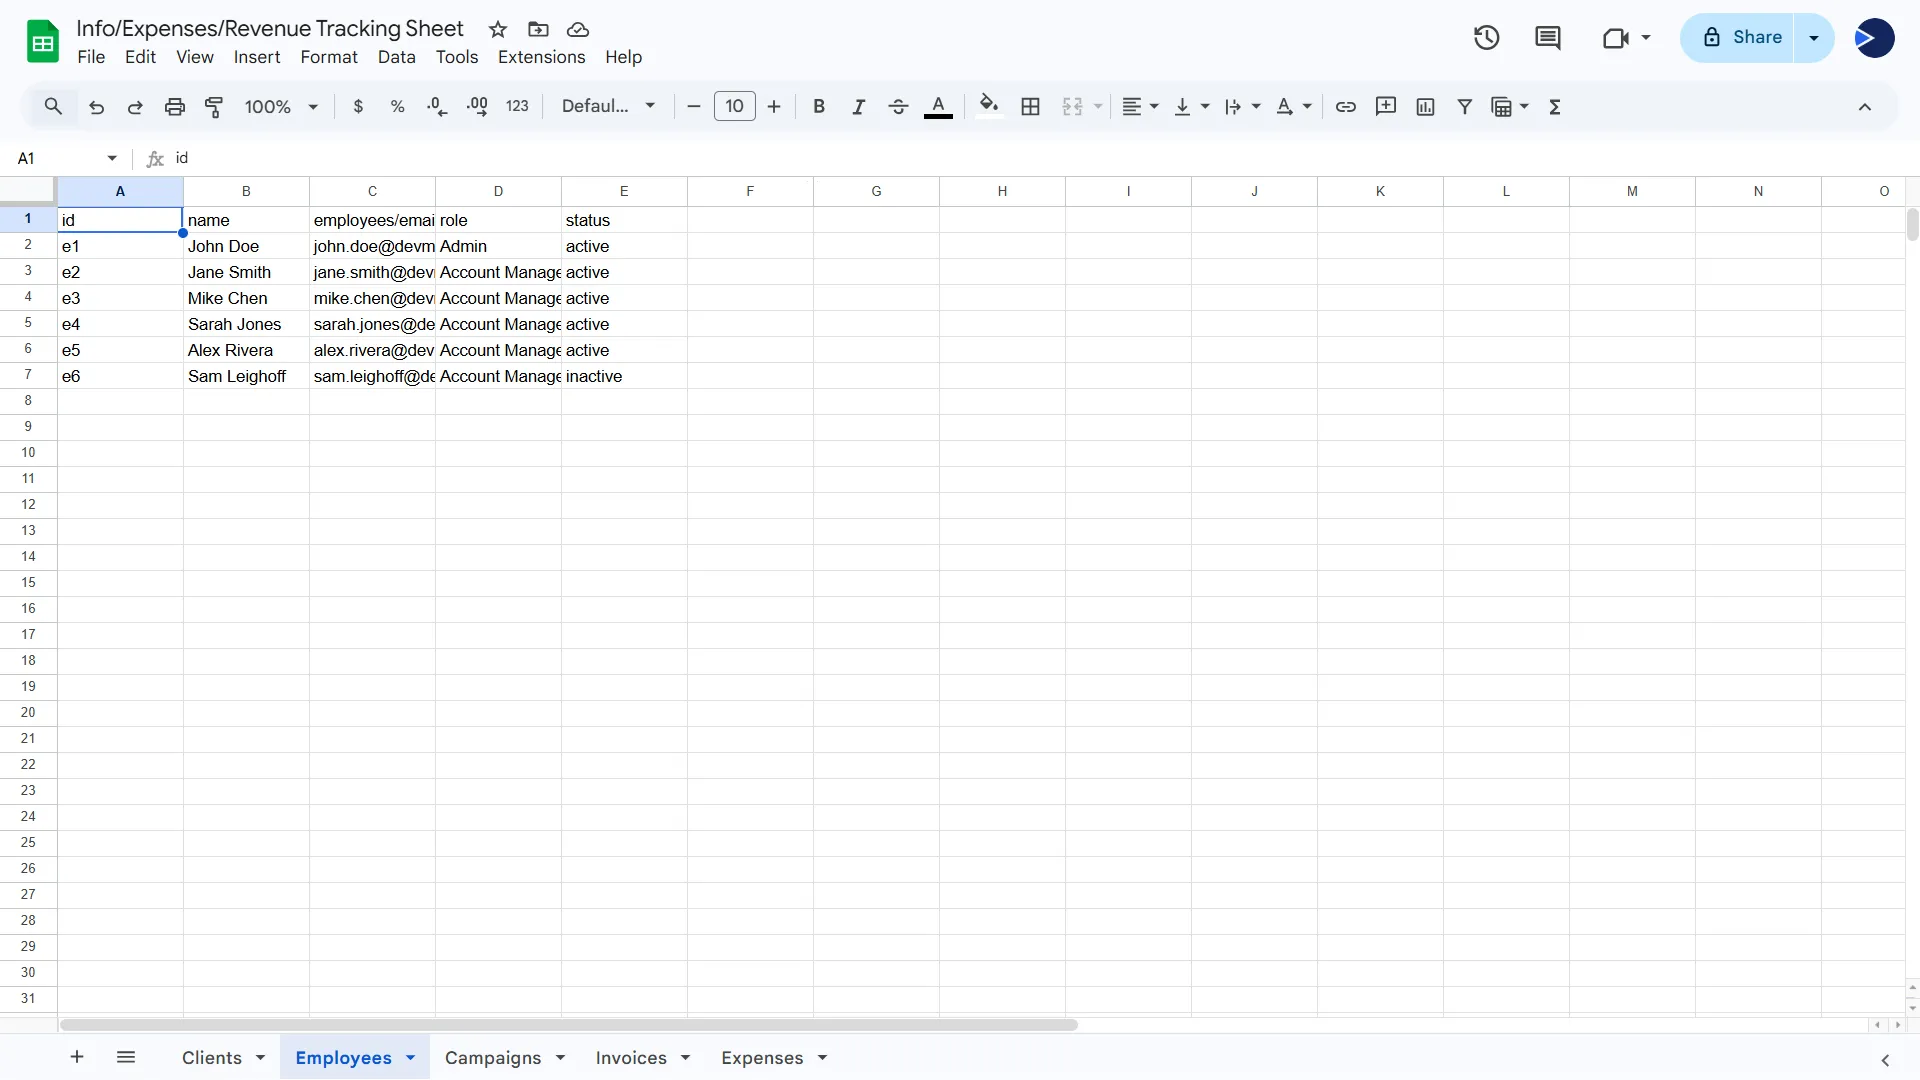
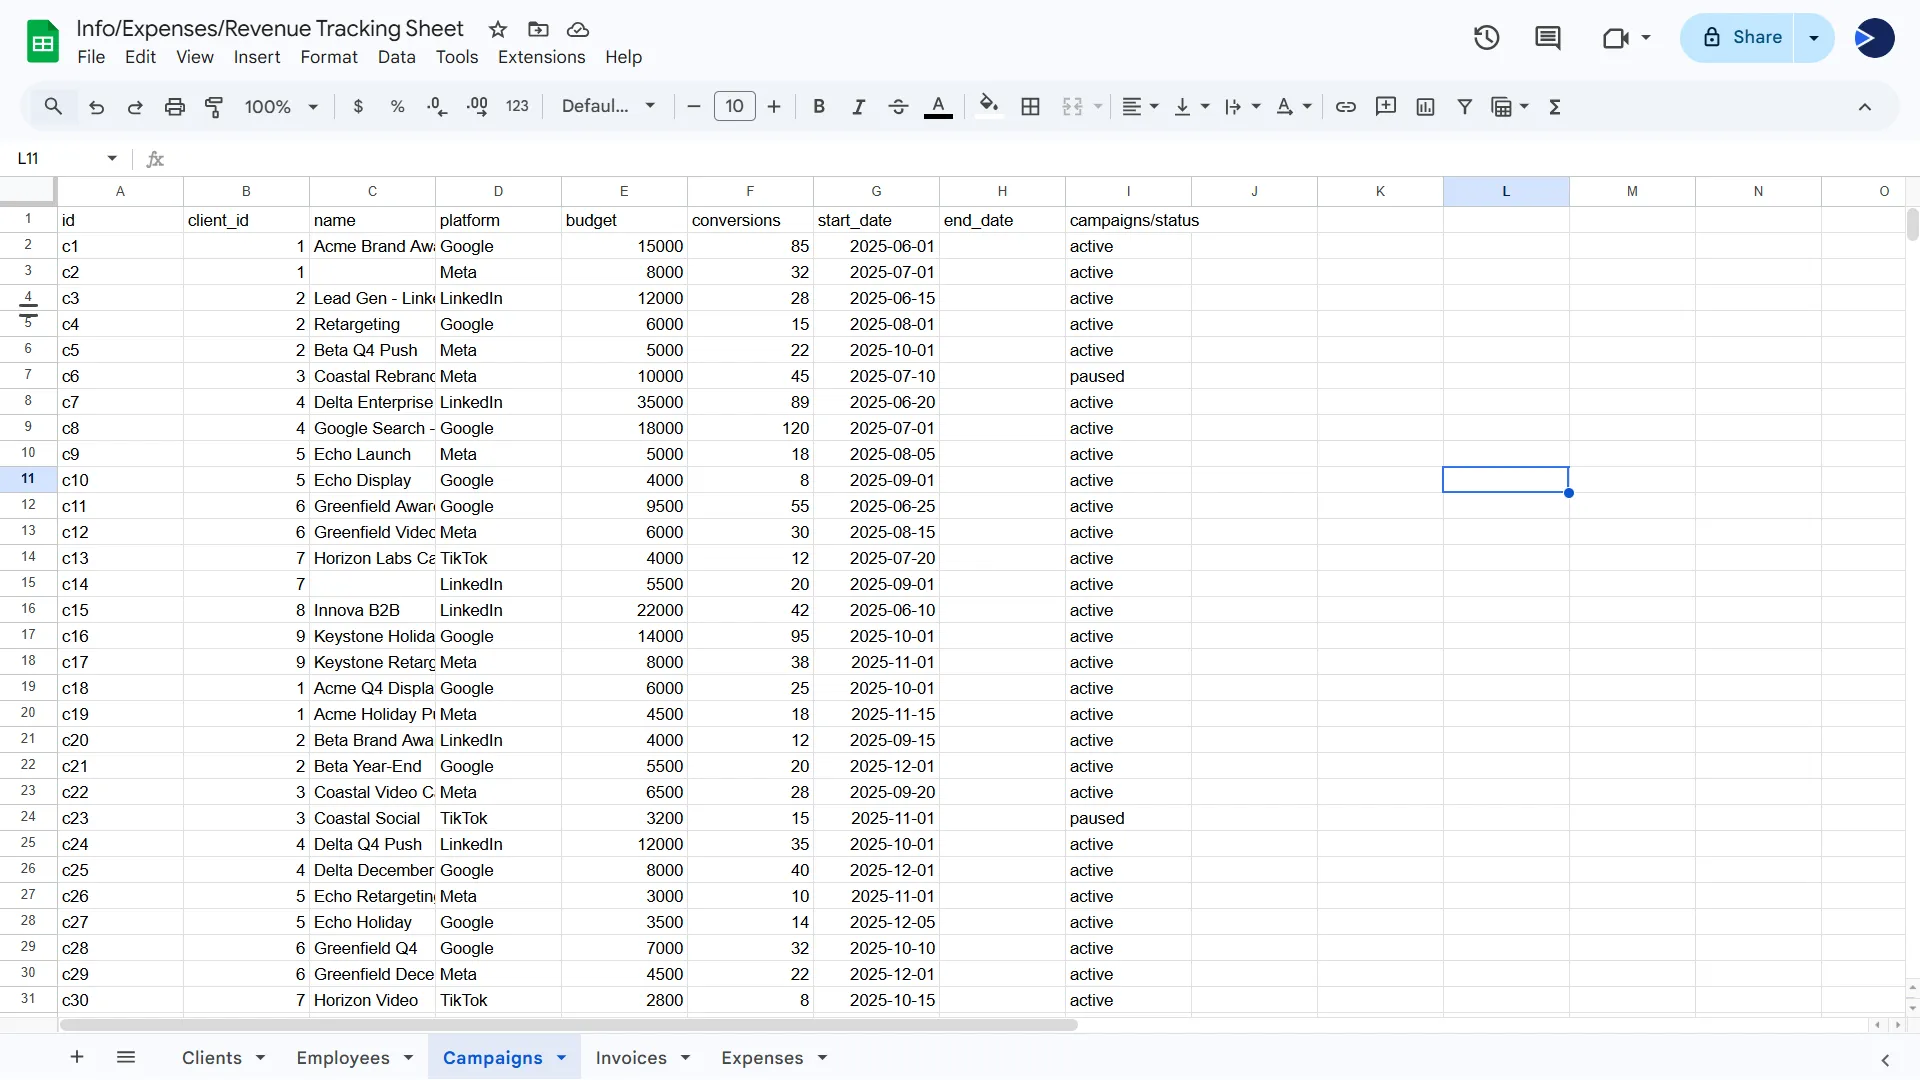
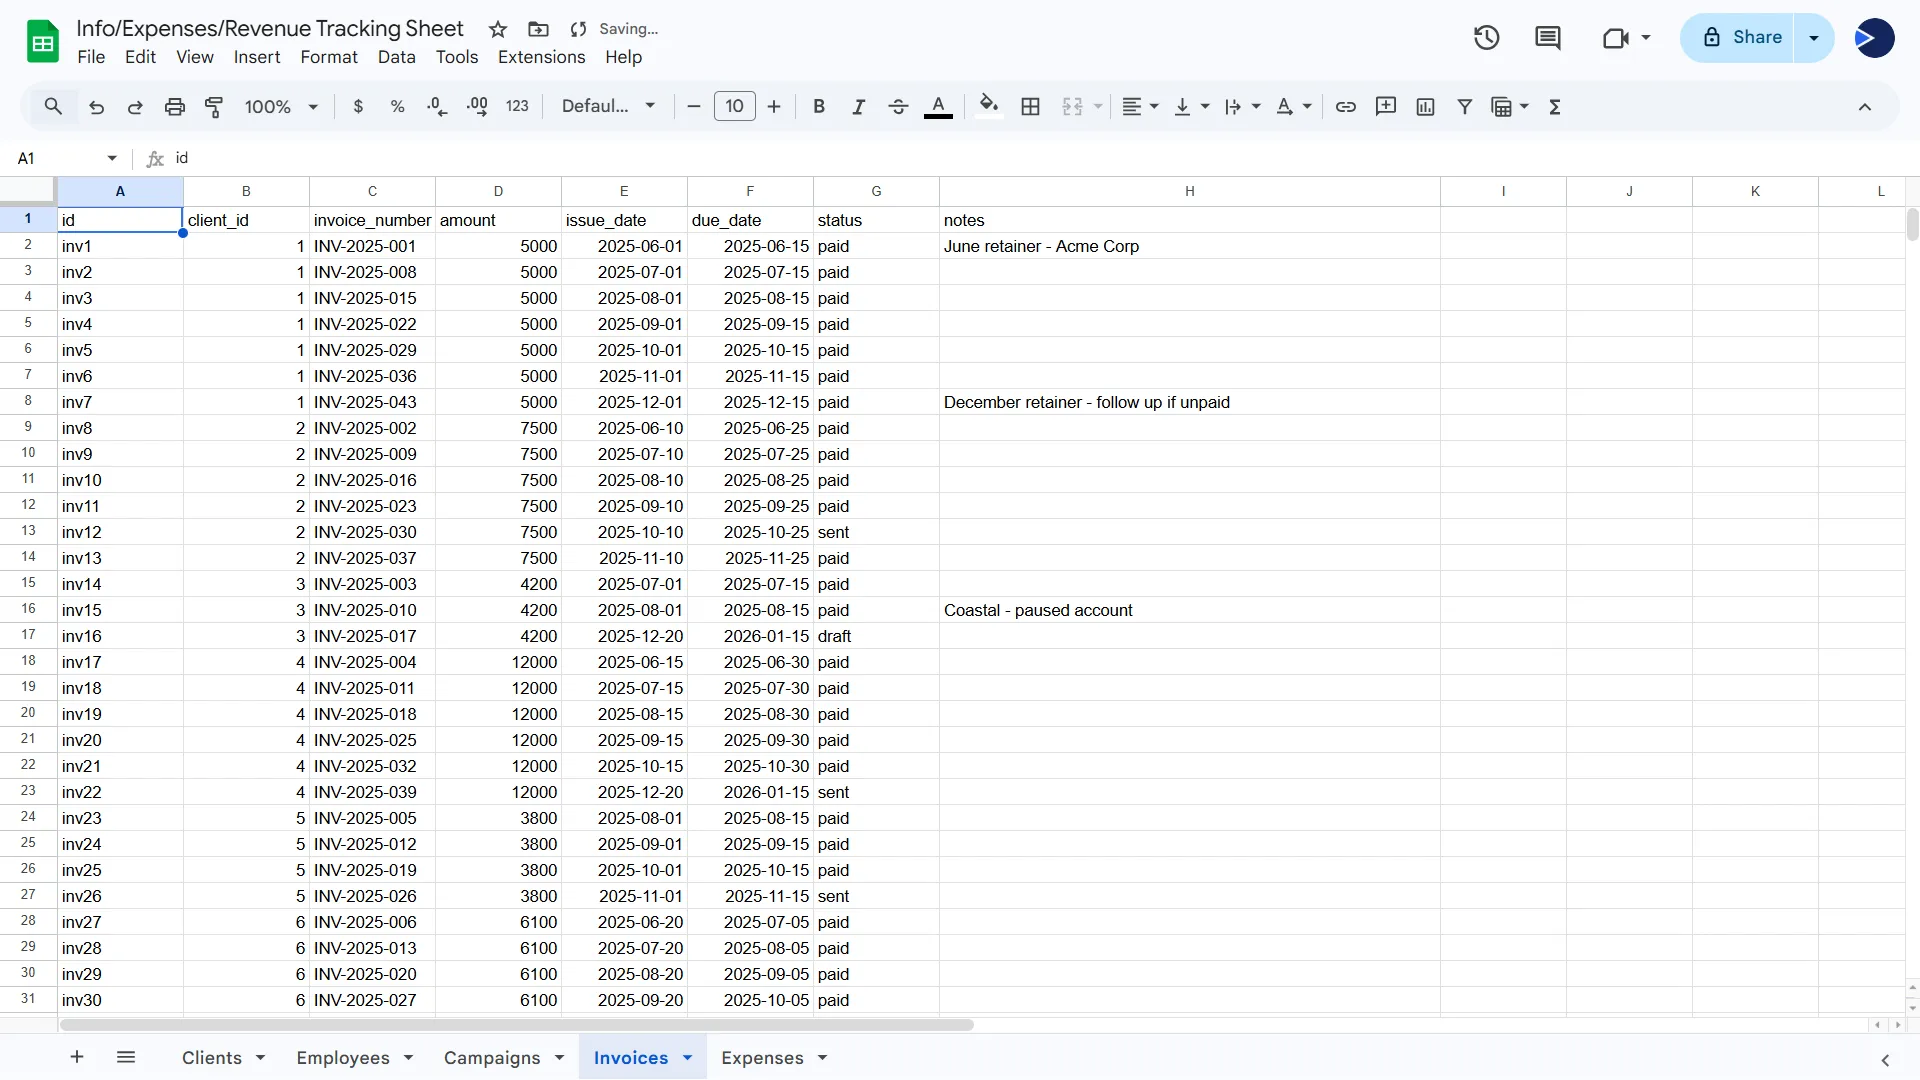
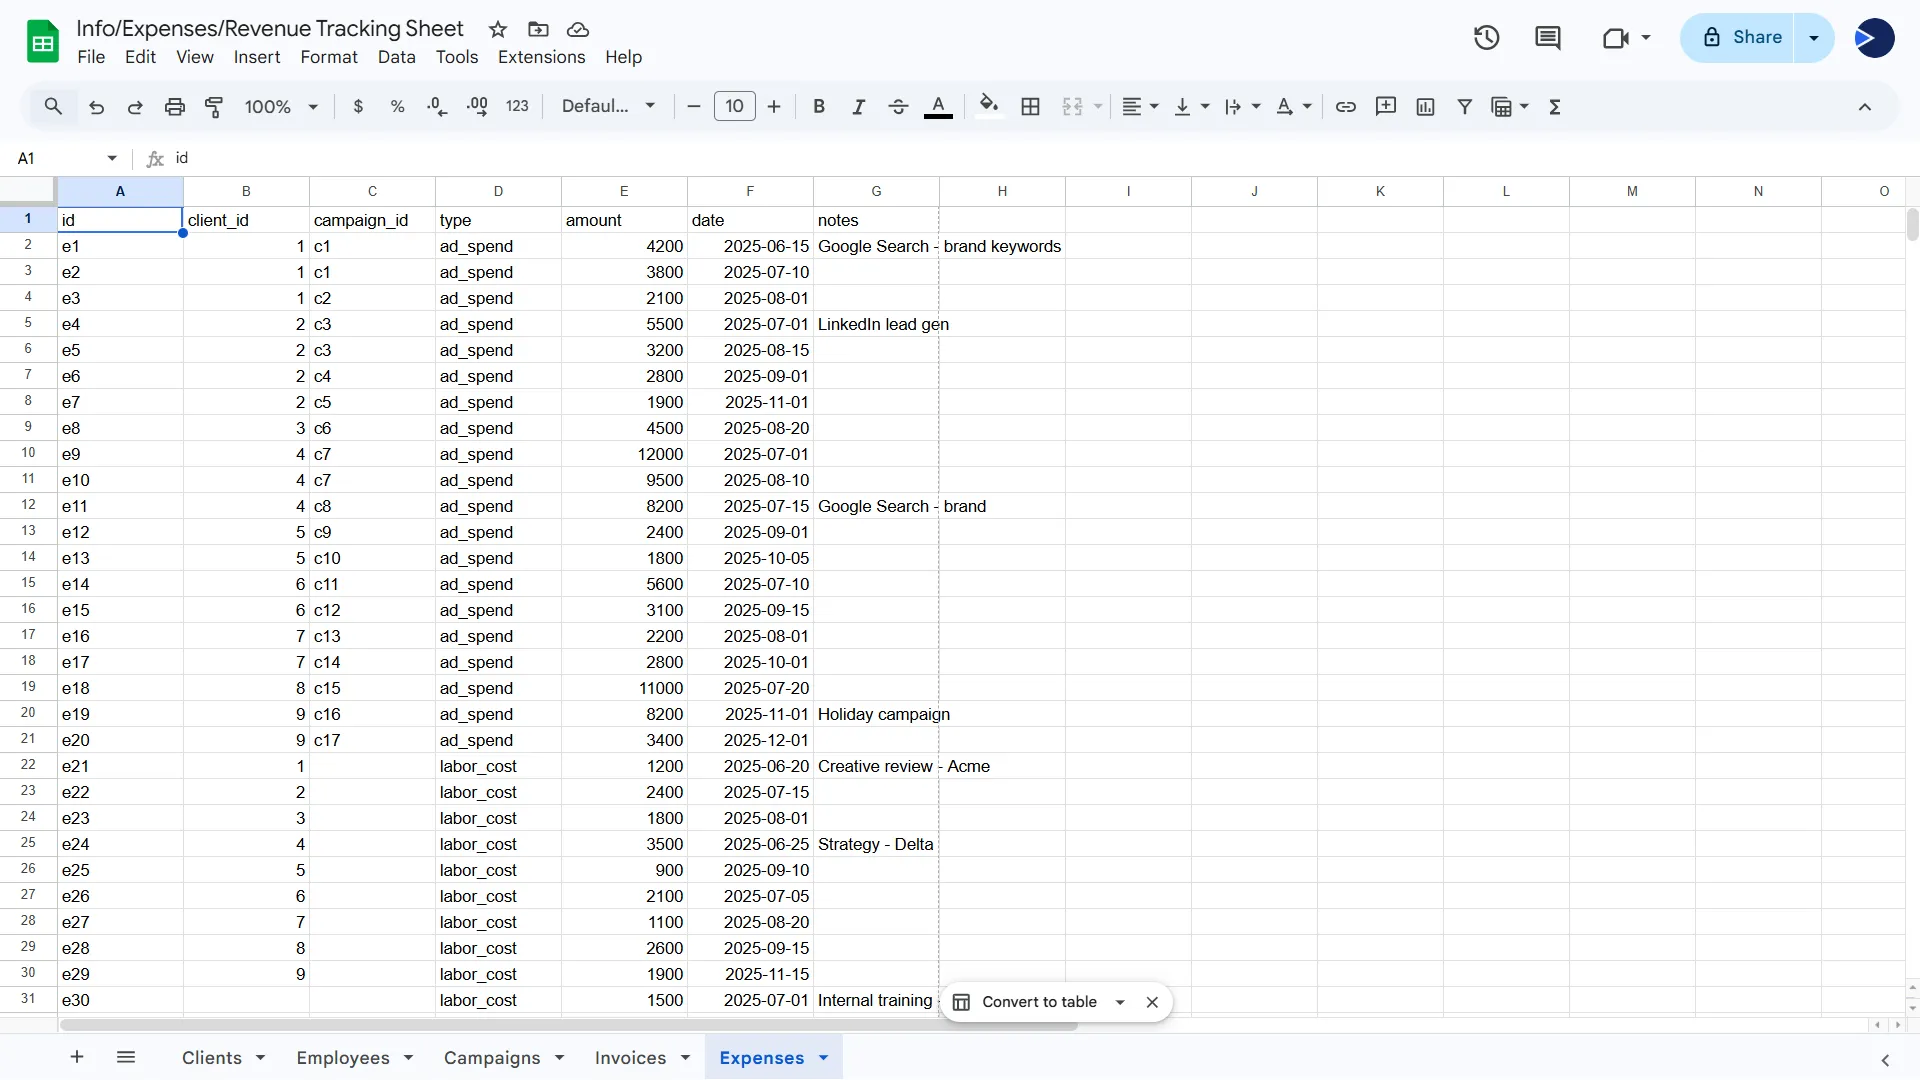
Disconnected spreadsheets, dozens of wasted hours each month
In our demo scenario, their team managed everything across five separate Google Sheets. Account managers spent up to 6 hours per client each month manually compiling data into PDF reports — even with just 9 clients, that's up to 54 hours a month on work that should be automated.
- Duplicated client data
- No link between revenue, campaigns, and invoices
- Manual monthly reporting
- No real-time visibility
- Typos and copy-paste errors
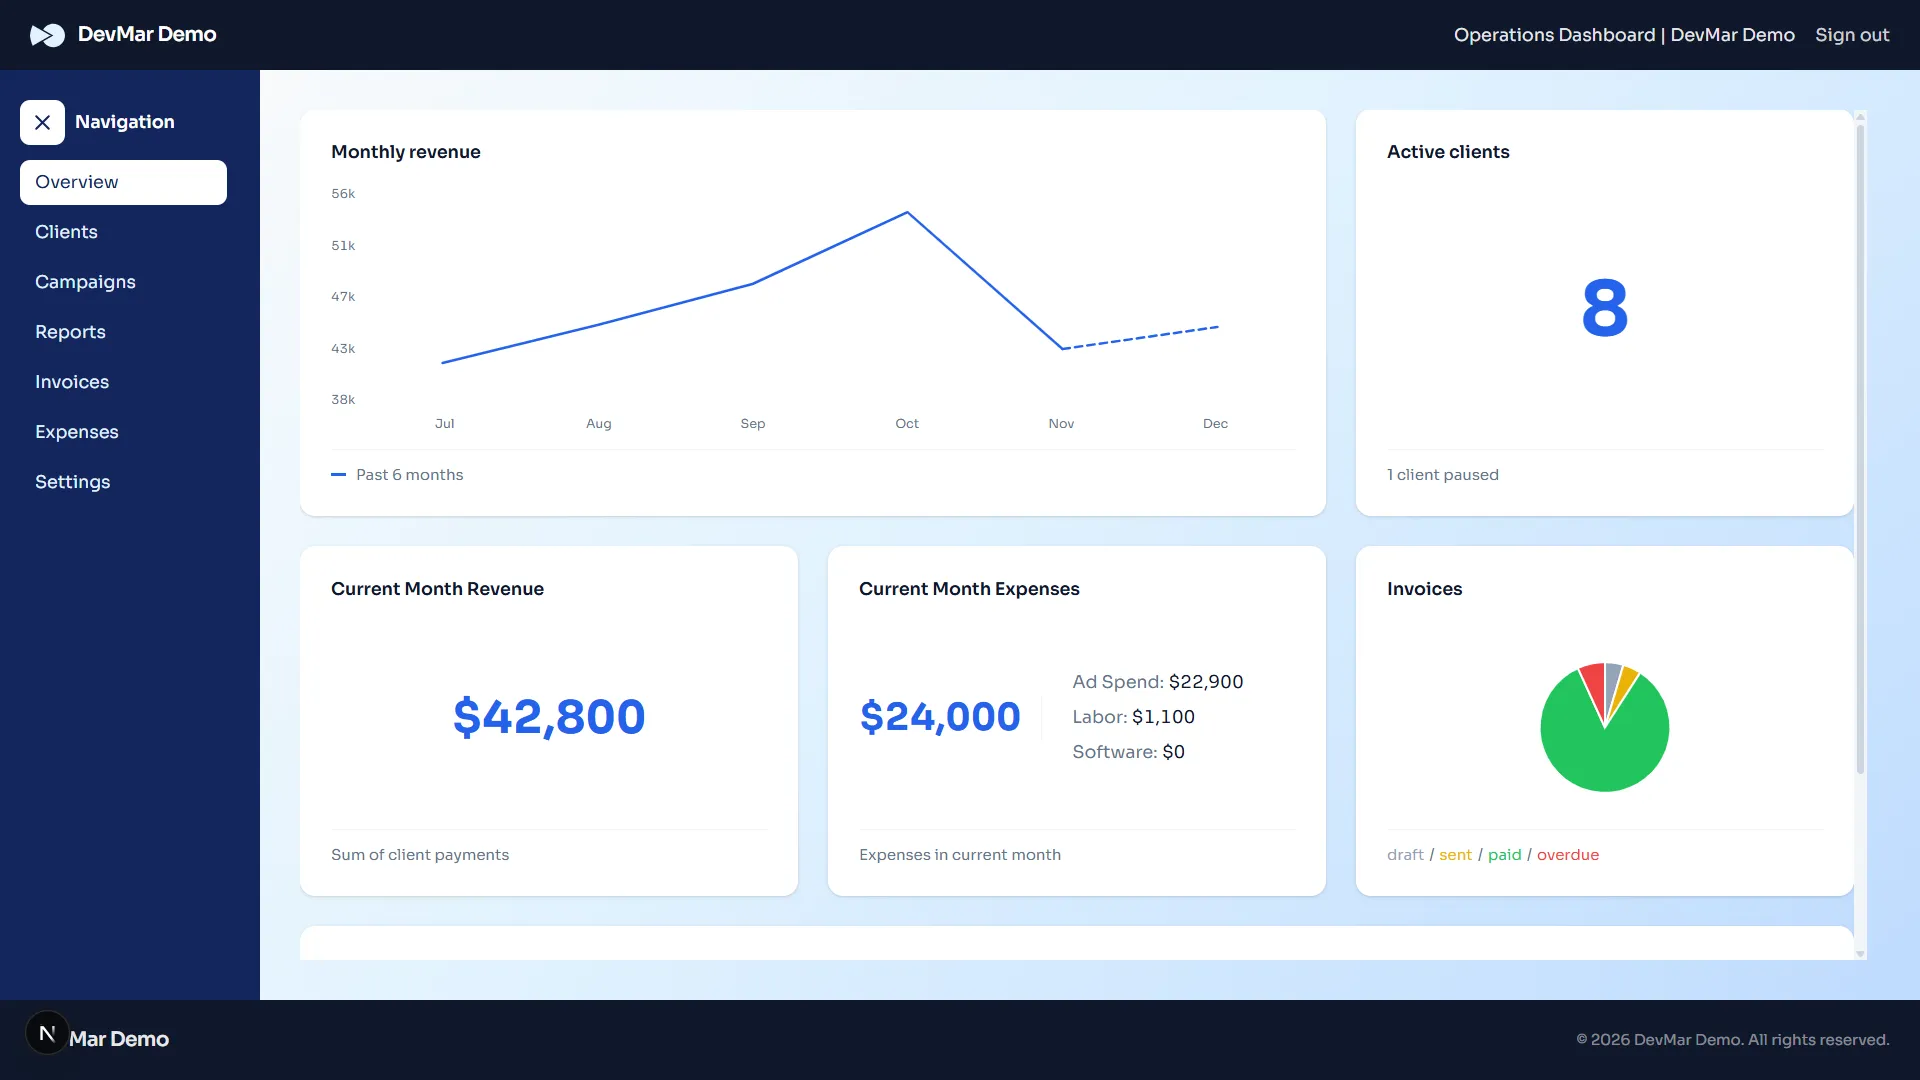
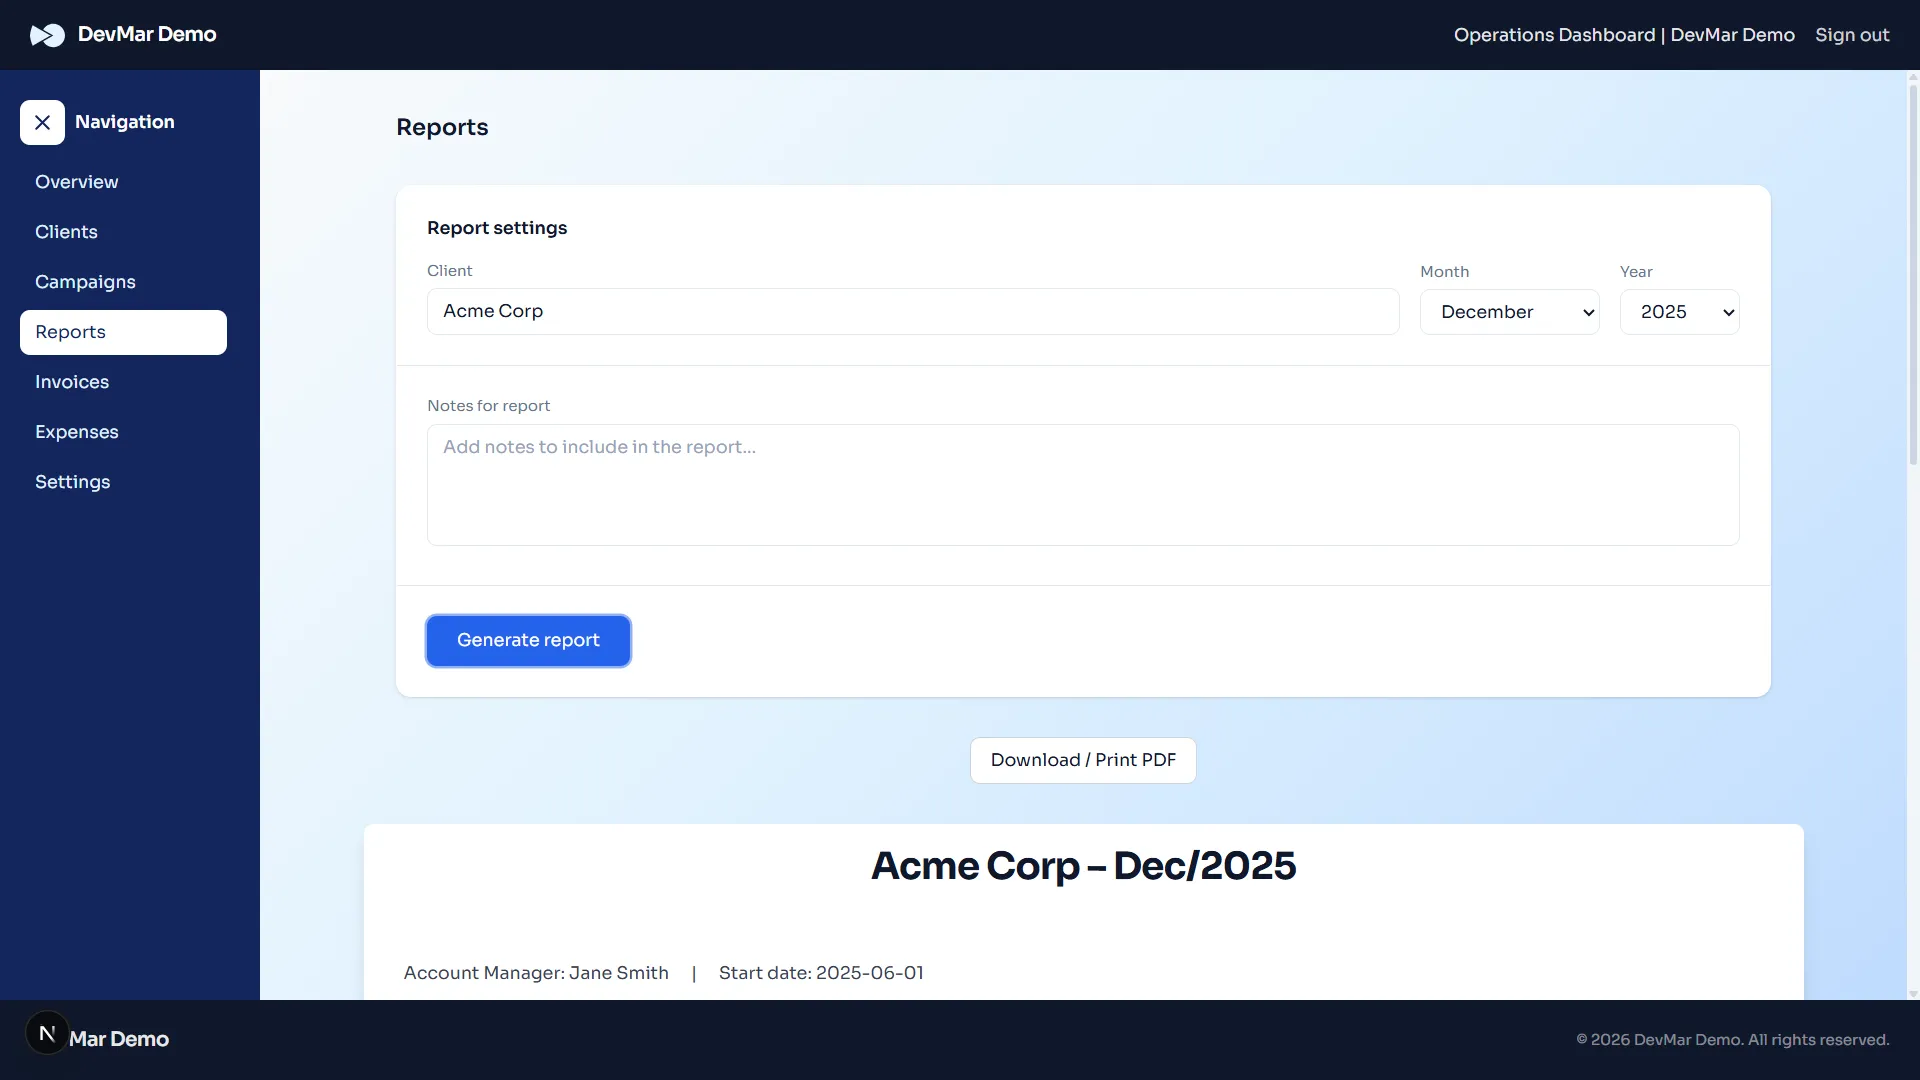
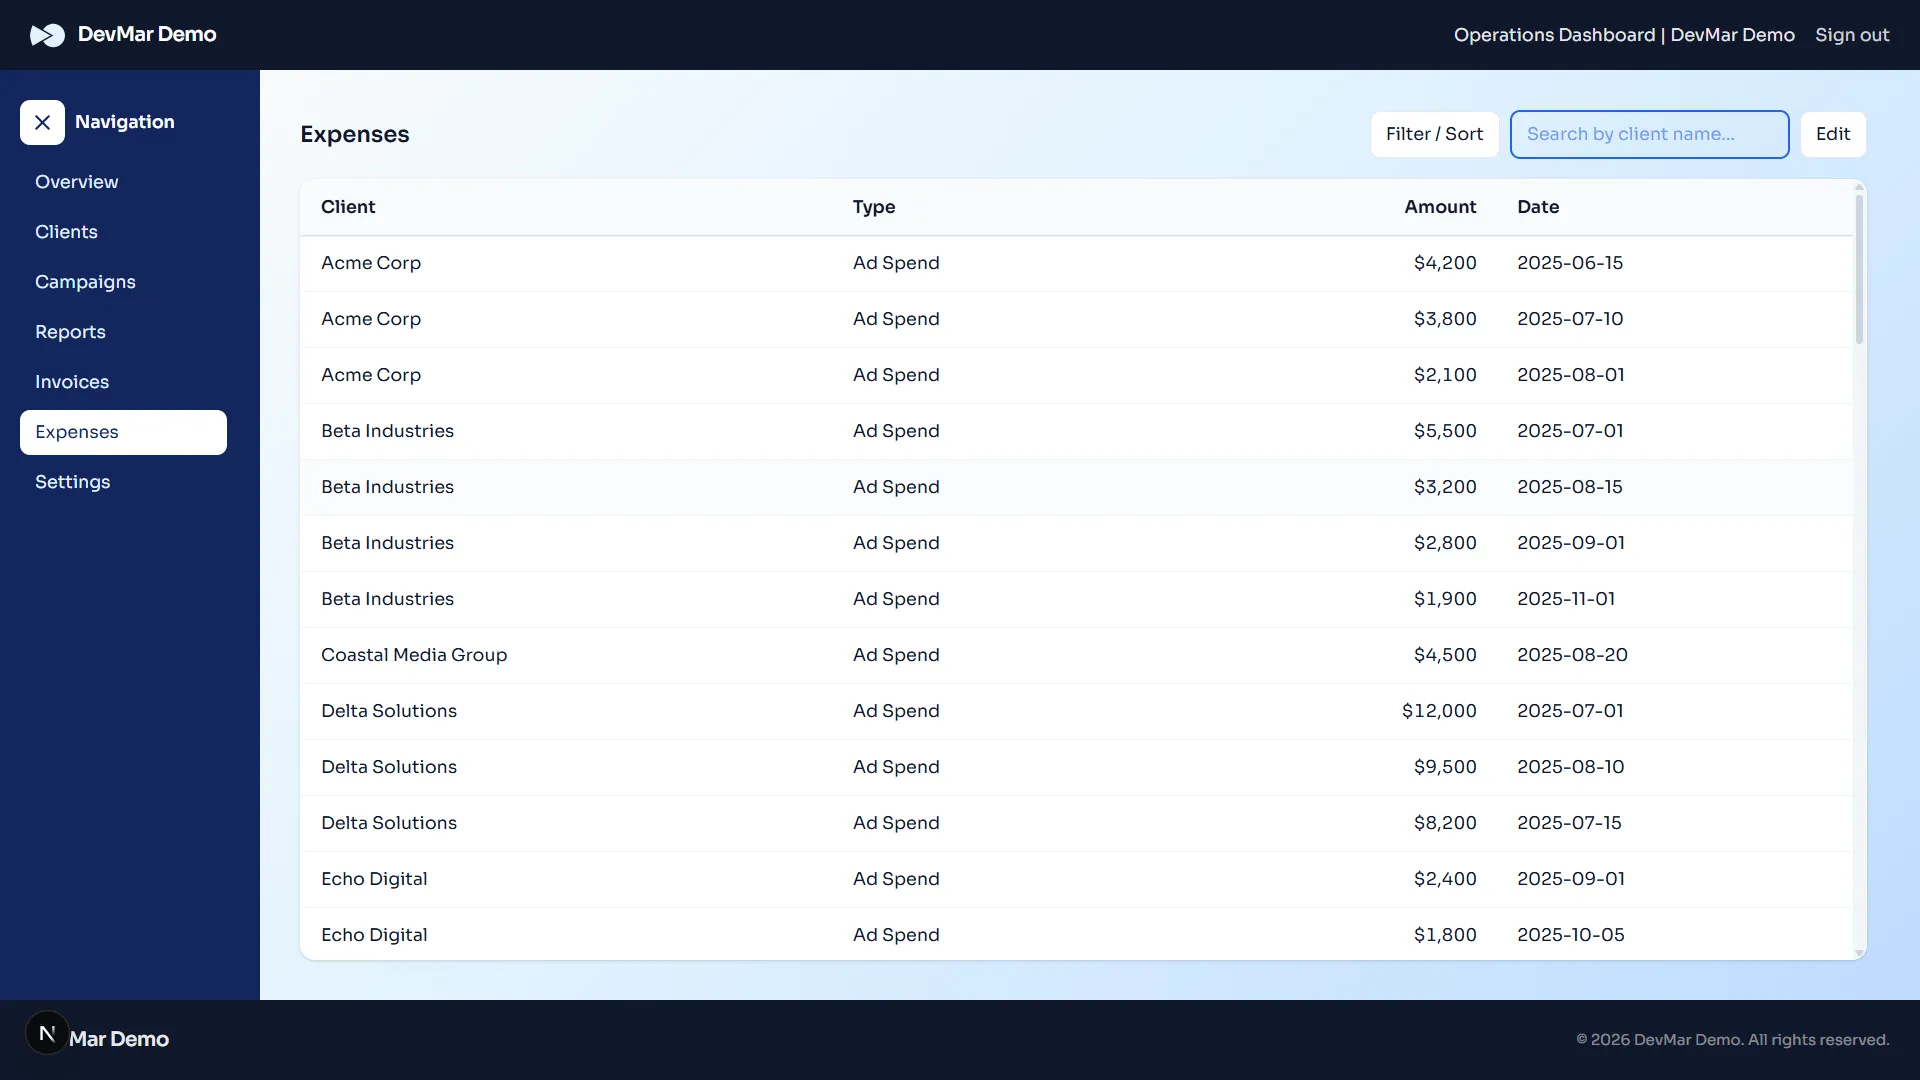
One dashboard. Everything you need.
We replaced the spreadsheet chaos with a centralized, live operations dashboard. The team sees client performance, revenue, and invoices in real time. Monthly reports are generated with just a few clicks.
- Live KPIs for revenue, spend, and margin
- Net profit and margin automatically calculated
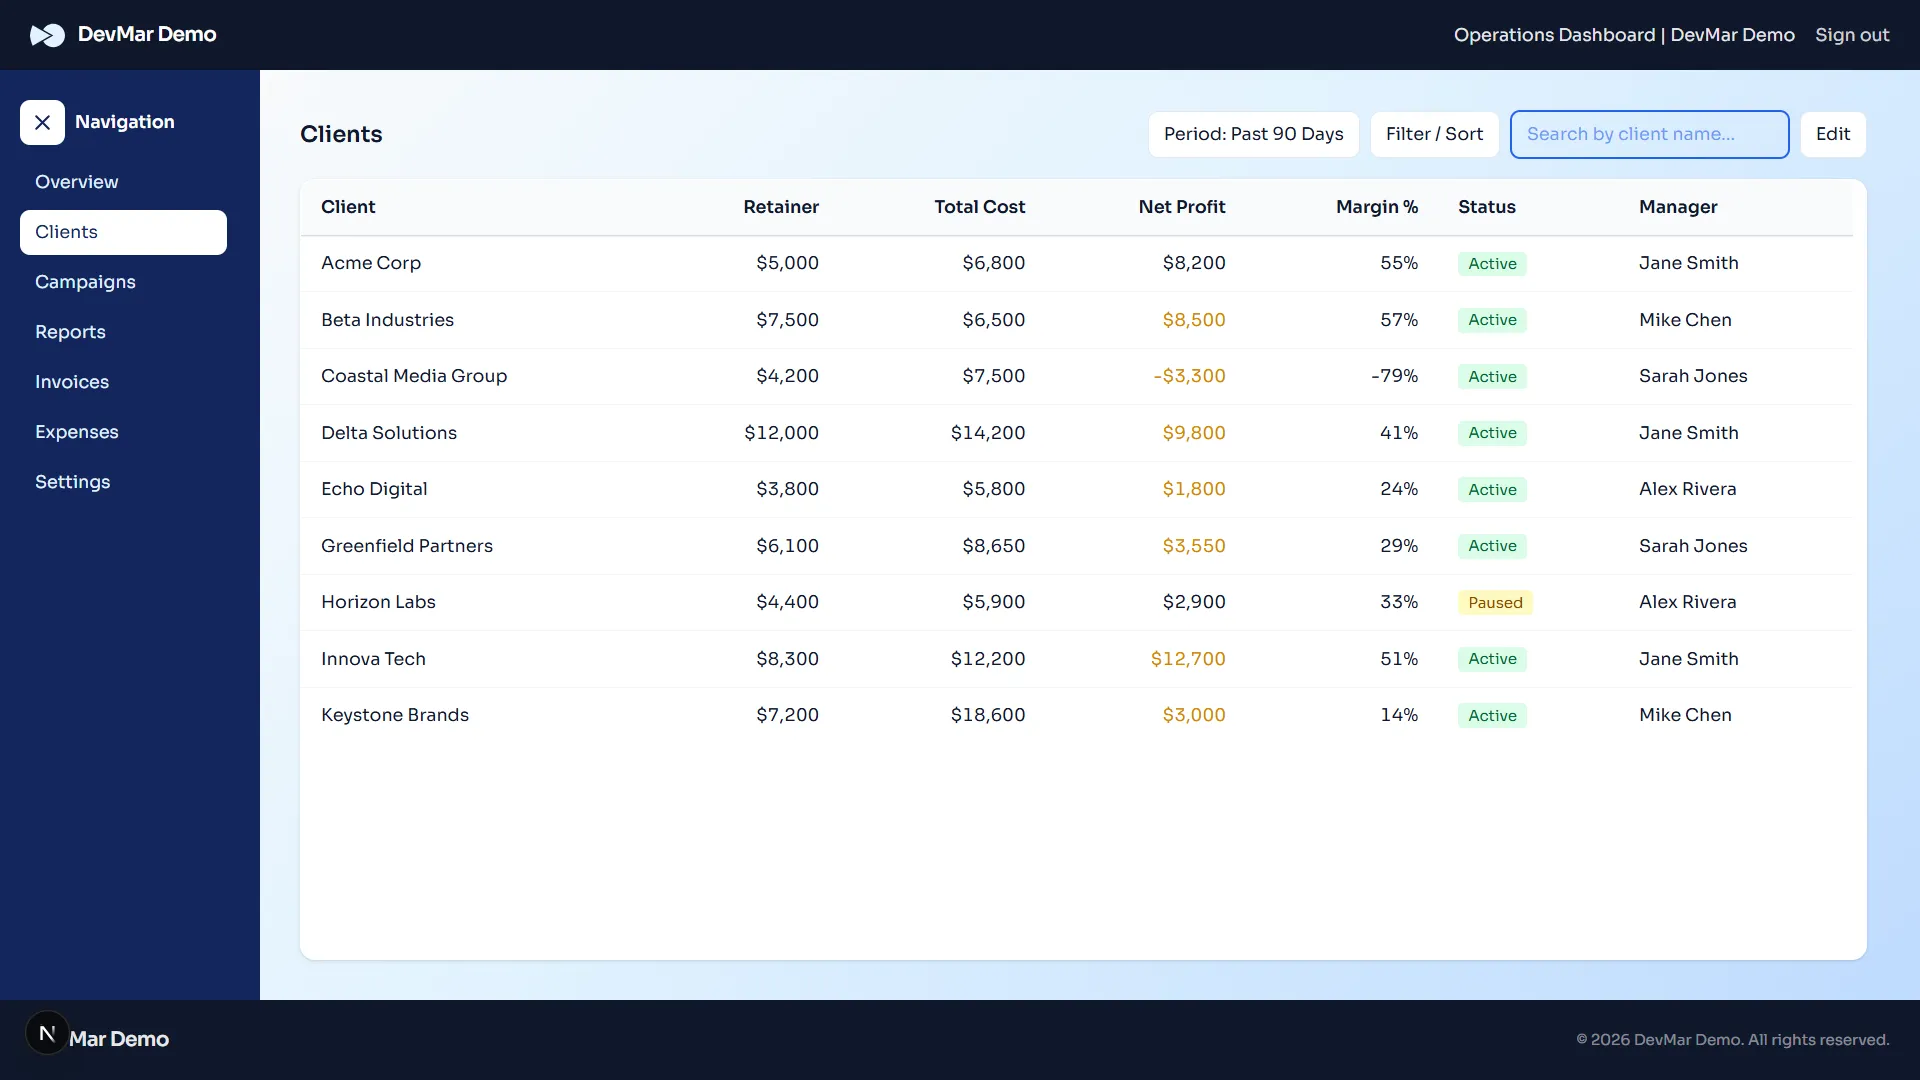
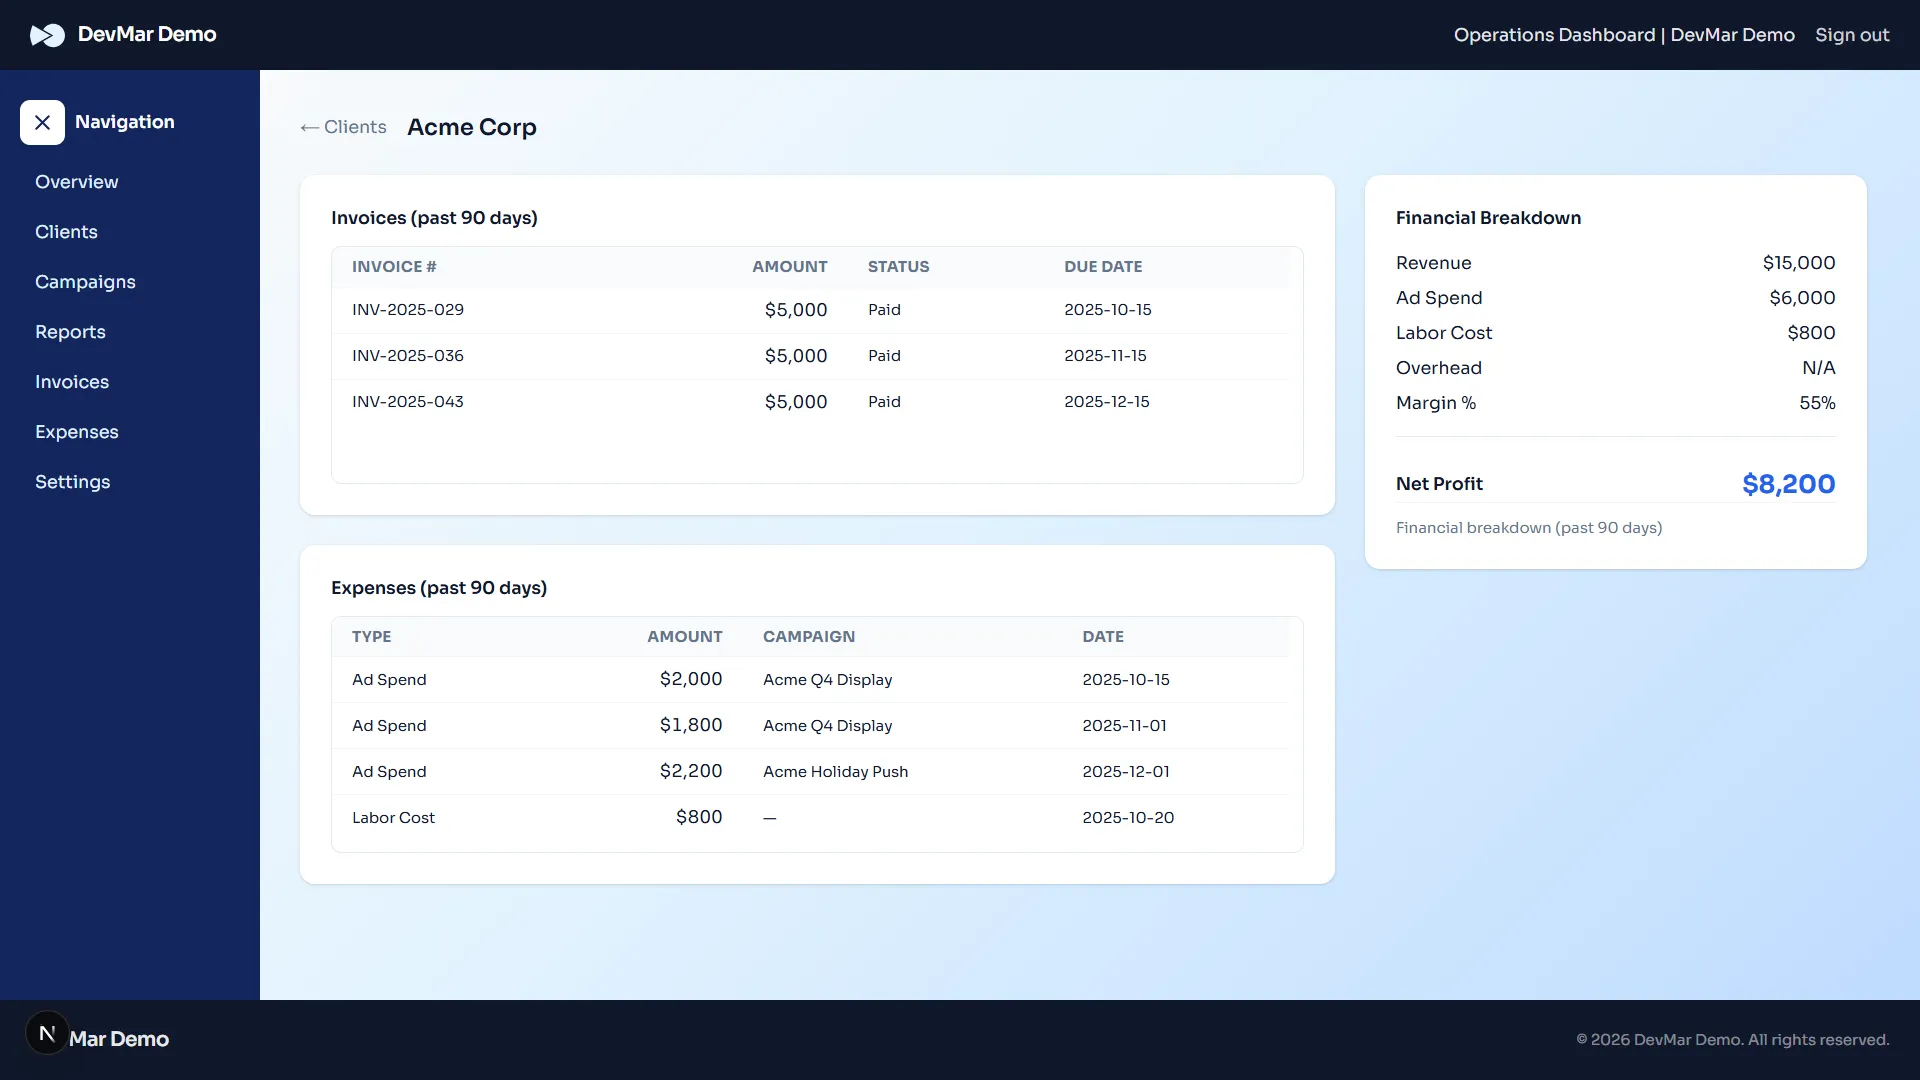
- Detailed client breakdowns
- Monthly reports generated in 2-3 clicks
- Over 50 hours per month freed up — saving thousands